This project offers a unique and innovative approach to address the critical issue of food insecurity in Nigeria. By leveraging machine learning models, we propose an optimal food basket designed to be affordable and culturally acceptable for Nigerian households. Our findings reveal two food basket models that can significantly reduce the cost of nutritious food and improve access to a variety of healthy options. As you continue to read, you will discover how our project can contribute to hunger alleviation, cash transfer, and health education programs in Nigeria. Join us in the fight against food insecurity and explore the exciting possibilities of optimized food baskets. I led a team of five Heinz College students in planning and executing this project.
Nigeria is facing a severe food insecurity situation, with millions of people across the country struggling to access sufficient and nutritious food. The causes of food insecurity in Nigeria are complex and multi-faceted. Although the Nigerian government and international aid agencies have taken steps to address food insecurity, the scale of the problem remains significant and more needs to be done to alleviate food insecurity in Nigeria. To address the food insecurity issue for Nigerian households, we propose an additional tool for the government’s toolbox: an optimal food basket designed to be affordable and satisfy food consumption patterns of Nigerian households. Our project proposes the use of a random forest supervised learning model to predict the food insecurity levels of households (low, medium or high) based on a food insecurity indicator (Coping Strategies Index). Alternatively, if households' food insecurity status is known, we propose the use of a K-Means clustering unsupervised learning model to group Nigerian households into clusters based on their characteristics (including food coping behaviors). Our specific model suggests two clusters. The machine learning models are used to obtain median food expenditure for each household group, which is then used to design two food basket models: a low-cost and a low-cost & culturally-acceptable food basket. We found that the low-cost food basket model cost NGN 115 across household groups and comprised 4 food items. While the low-cost & culturally-acceptable food basket model comprised a wider variety of food items and was priced at the median food expenditure for each household group. As a means to fight food insecurity, we recommend the food basket model optimized for low-cost and culturally acceptability to the Nigerian government for implementation in hunger alleviation, cash transfer and health education programs. We acknowledge that our project is subject to several data, analytical and economic limitations, some of which we address as future work.
For Nigeria, food insecurity is a severe problem with the country ranking 103 of 121 countries assessed for the Global Hunger Index (GHI) in 2022[1]. With a population of over 200 million people, the WFP’s hunger map reports 57.7 million people in Nigeria with insufficient food consumption – that’s over a quarter of the population living with food uncertainty[2]. Many Nigerian households struggle to afford a nutritionally adequate diet, leading to poor health outcomes and decreased quality of life. As it is crucial for everyone to have the equal access to sufficient and nutritious food to meet dietary needs, our research question is: How to design a nutritionally adequate, low-cost and culturally acceptable food basket (list of locally available food items) for Nigerian households based on the similarity of their food insecurity level as measured by the coping strategies index? This research is important for addressing food insecurity and improving the health and well-being of Nigerian households.
To answer our research question, we set the following objectives:
- Calculate Nigerian households’ food insecurity levels based on the Coping Strategies Index (CSI)
- Create sub-groups of Nigerian households with similar coping patterns
- Predict Nigerian household food insecurity levels
- Design optimal food baskets for Nigerian households in fulfillment of the U.S. Food and Drug Administration (FDA) nutrient recommendations while considering affordability and cultural acceptability
Data Summary
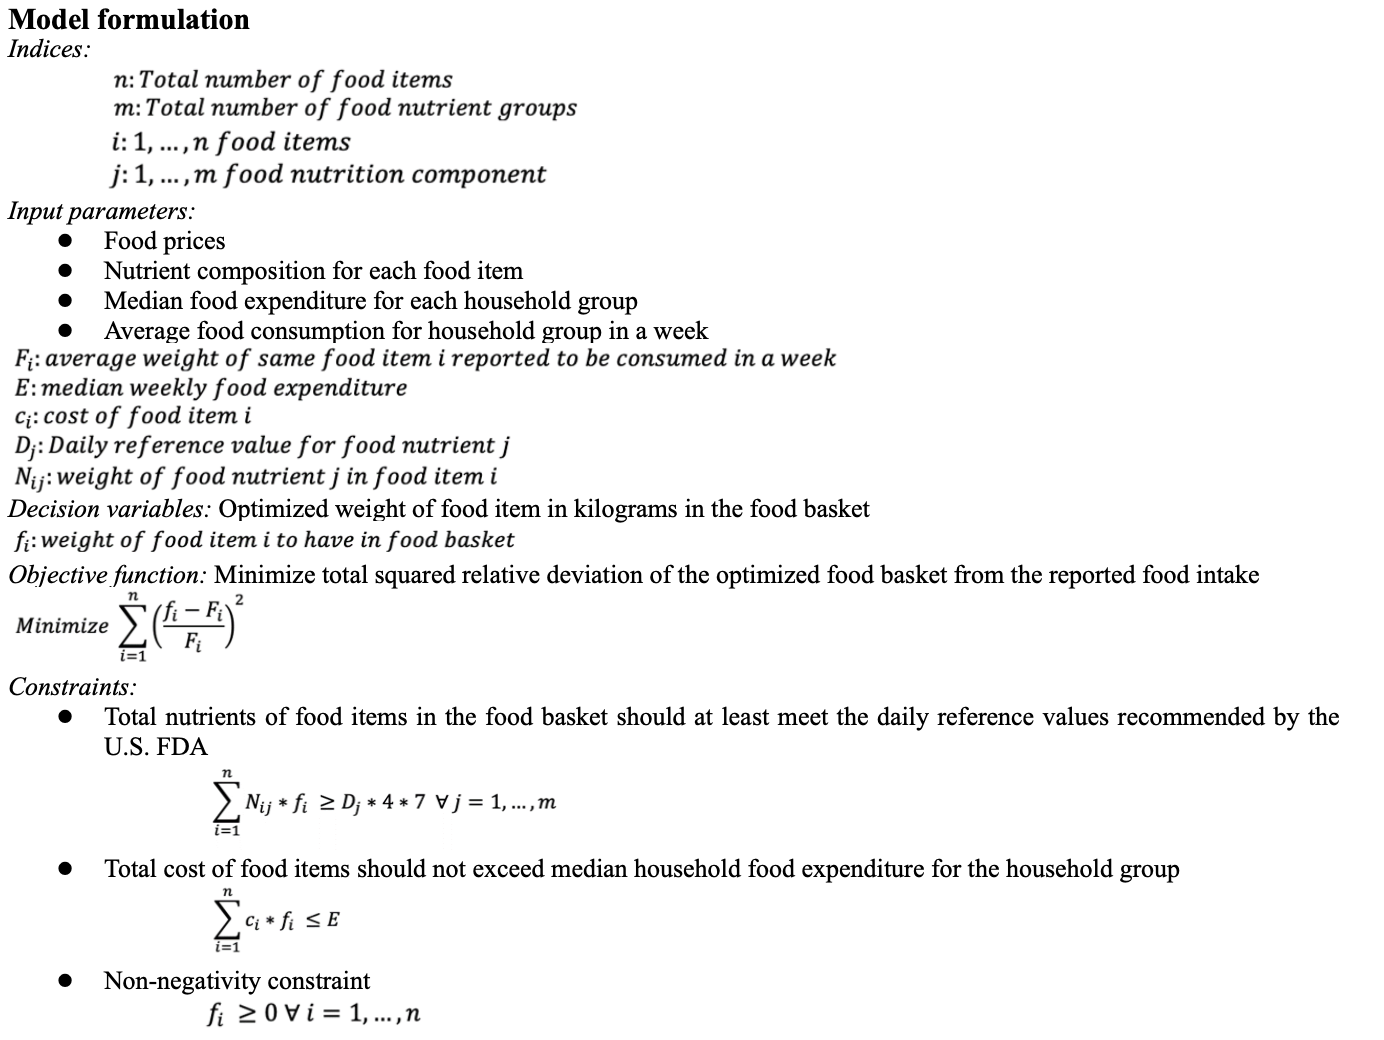
The primary data source used for this project is the Nigeria General Household Survey (GHS) data, panel 2018 - 2019, conducted in Nigeria under the collaboration between the World Bank, the Federal Ministry of Agriculture and Rural Development, the National Food Reserve Agency, and the Bill and Melinda Gates Foundation. The GHS is a nationally representative survey of approximately 5,000 households from six geopolitical zones in Nigeria. The survey data consists of 3 main questionnaires administered over two rounds (post-planting and post-harvest): household, agricultural, and community. Since the project is not focused on agricultural endeavors, the post-planting survey round served as our main dataset– with a focus on household and community questionnaire responses. The data sections considered from the household and community questionnaires for the project were credit access, food expenditure, food security, dwelling type, economic shock, and food prices. We selected features from the aforementioned data sections for our models to characterize households’ severity of food insecurity and design food baskets. For recommended nutritional components, we used daily recommended values from the U.S. FDA. For the nutritional composition for food items in our dataset, we used the Nutrient Value of Some Common Food document by the Canadian Ministry of Health. For food items that were not found on the aforementioned list, we obtained the nutritional composition value from several other sources. Our data dictionary outlines the data sources used for our project as well as descriptions for all features used.
Data Cleaning
Our data cleaning goal was to ensure that our dataset was consistent, complete and ready for further analysis. First, we sought to identify errors, inconsistencies, and missing values in our datasets. This was important to improve the reliability of our results. Our data cleaning for household data was done in R. Our main focus was on re-coding responses into binary values, creating dummy variables for household dwelling types and economic shock features, aggregating household food expenditure for each household, and feature engineering the CSI variable (discussed in section 2.3.). With readily prepared data files, we merged multiple data sets into a single data file on household-level (i.e. a single record for each household) for analysis. Our merged household data file is called hh_data.csv, and comprises 4,170 households with its full variable list outlined in our data dictionary. For the food prices and nutritional components of each food item, we used the food price list from the community questionnaire as the base file. Next, we computed the food nutrient composition for each food item based on standardized units (kilogram for solid food items and liter for liquid food items). This new breakdown is used as our conversion table and is the foodprice_nutrition.csv data file.
Feature Engineering
We had raw data (responses to questions in Fig.1) on household food coping behaviors but needed to transform this data into a meaningful feature that could be used as an indicator of food insecurity level for use in our analysis. Thus, we selected the Coping Strategies Index(CSI) as the household food insecurity indicator of interest. The CSI assesses the behavior of people when they cannot access enough food. CSI is calculated based on a series of questions aimed at providing different answers to the sole question: “What do you do when you don’t have adequate food and don’t have the money to buy any?” We computed the CSI score for each household as a weighted sum of quantified responses (Yes/No) to coping behaviors. The weighted scores were divided into 3 groups for food insecurity level[4]: low (0-9) = 1, medium (10-18) = 2, and high (19-27) = 3. The resulting feature is a 1-3 label for each household indicating the food insecurity group.
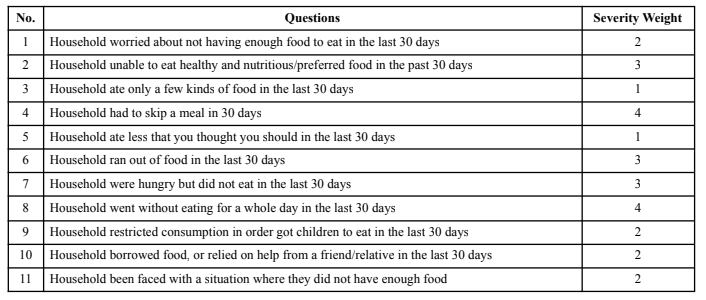 Fig.1: Hunger coping behavior questions and severity weights
Exploratory Data Analysis
From exploratory analysis, we see in Fig.2 presented below that approximately 68% of the 4,170 respondents live in urban areas. Fig.3 below shows that a high proportion of respondent households are potentially experiencing high food insecurity. For the relationship between food expenditure and food insecurity level, we assumed that households facing higher food insecurity would have lower food expenditure. However, visualizing the data shows that the average food expenditure from the dataset does not necessarily characterize coping behaviors as expected e.g. there is an outlier at the CSI score of 26. For the economic shocks, the graph shows that about 16% of respondent households were impacted by an increase in food prices. We noted this as a potential area for further analysis. More EDA plots and charts are included in our EDA code file.
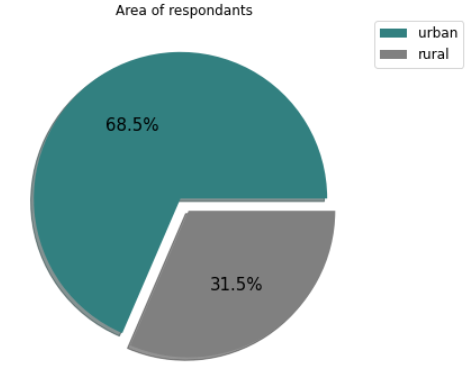 Fig.2: Area of respondents
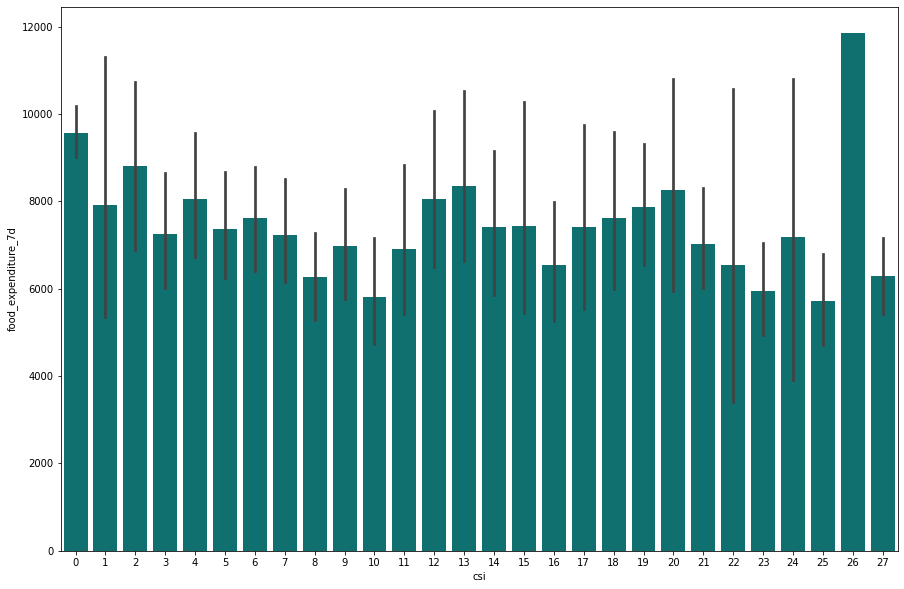 Fig.3: Distribution of household’s CSI level
Assumptions
The project is subject to the following assumptions:
- Reference family size for computations is four adult household members for each household
- Total food expenditure in the dataset for each household is their average weekly food expenditure
- Maximum food basket cost is based on median household expenditure for each group/cluster
- Consumption coping behavior questions used for computing CSI are relevant to the Nigerian cultural context
- Household members do not require specific dietary requirements
- Food prices are converted to per kilogram for solid items and per liter for liquid items
- Food prices are captured based on the average food prices for each item
- Food nutrients for each food item are converted based on the same unit as the food price (per kilogram for solid items and per liter for liquid items)
Model Plan
For this project, our methodology was first to develop food insecurity profiles for Nigerian households using machine learning, then subsequently, create optimized food baskets for the household groups. The diagram below shows the implementation process flow:
Machine Learning
Our machine learning goal was to develop food insecurity profiles for Nigerian households based on the following features:
- household sector (i.e. urban vs rural)
- household dwelling type
- loan access
- total weekly food expenditure
- percentage of food consumed that was self-produced
- percentage of food consumed that was purchased
- percentage of food consumed that were gifts
- household economic shocks
Supervised Learning
The supervised learning model was aimed at predicting the food insecurity levels of Nigerian households. Thus, the true labels of the dependent variable were based on the households’ food insecurity groups: 1 for Low, 2 for Medium, and 3 for High. A predictive supervised learning model would be applicable in an instance where some household characteristics, outlined as features above, are known but the household food insecurity level is unknown and unlikely to be computed due to a lack of household behavioral coping data i.e. data on households’ behaviors when they cannot access food.
Models
5-fold cross validation was used along with model hyperparameter tuning to fit and evaluate all supervised learning candidate models used in this project. Then the models were evaluated for best performance based on accuracy. We used accuracy to measure performance since we were interested in the percentage of correct predictions made by our models. The following were candidate models:
- Linear Discriminant Analysis (LDA)
- Quadratic Discriminant Analysis (QDA)
- K-Nearest Neighbors (KNN)
- Classification Tree
- Random Forest
Since logistic regression is difficult to interpret for more than 2 classes, the first model trained was the LDA. Since LDA assumes different means for each class and same covariance matrix for all classes, we assume that assumption approximately holds. In this case, we assumed that the joint distribution of the classes follows a shape that can be characterized by a few features. For LDA, we assumed that the decision rule depends on a feature only through a linear combination of all features. For the LDA model, the training accuracy was 57.4%
QDA was tried as an alternative approach to LDA. For QDA, the assumption is that unlike LDA, each class has its own covariance matrix. Thus, we assumed the decision rule depends on a quadratic function. For the QDA model, the training accuracy was 56.9%
For KNN, based on the assumption that similar points can be found in close proximity to one another, we tried out between 1 to 20 neighbors during hyperparameter tuning. The optimal number of neighbors for the data and model parameters was 18. The training accuracy was 56.4%
For ease of interpretability, we tried a decision tree classifier. Based on recursive binary splitting, we used the decision tree classifier to assign a household in a given region of the dataset to the most commonly occurring class of training observations in that region. Thus, predicting the household food insecurity group for each household. The optimal maximum tree depth after model tuning was 3 and the training accuracy was 57.1%
We hoped to improve the predictive accuracy of the classification tree by aggregating many decision trees. We picked random forest over other aggregate tree methods like bagging, whose predictions are based on highly correlated trees, since random forest overcomes this issue by forcing each split to consider only a subset of features. We also checked for feature importance (shown in Fig.4) for better clarity on the model’s performance. The optimal maximum tree depth after model tuning was 8 and the training accuracy was 57.4%
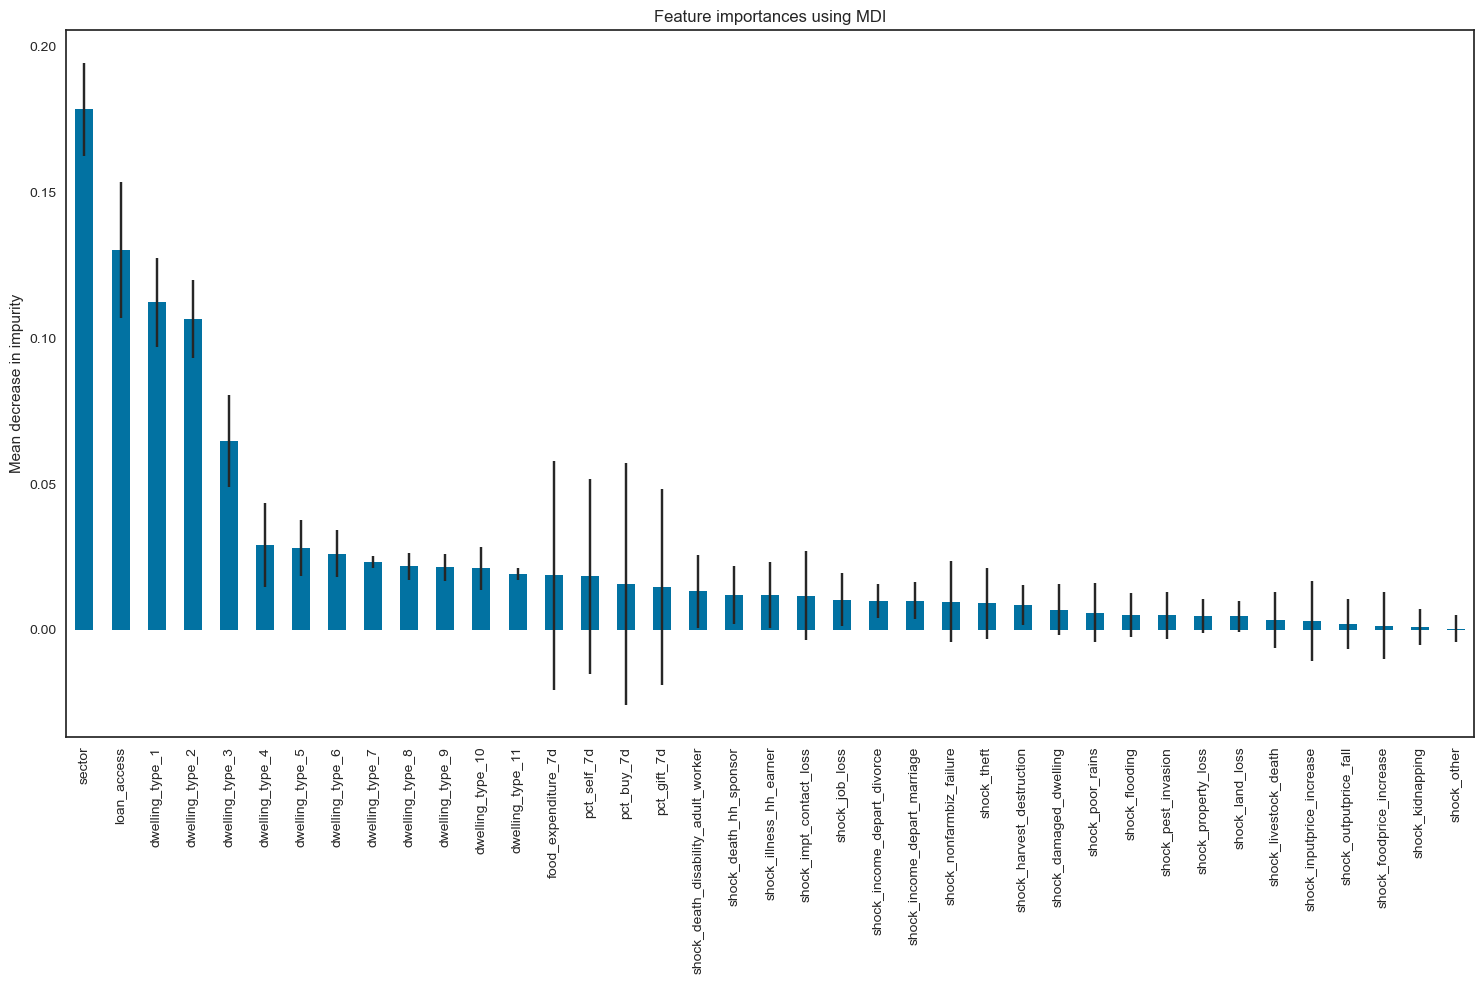 Fig.4: Feature importance graph
Though LDA and random forest had similar training accuracy, we selected random forest as our best performing model since it is a nonparametric and more robust model.
Unsupervised Learning
The unsupervised learning model was aimed at identifying homogeneous subgroups within Nigerian households at similar food insecurity severity levels. Thus, all features outlined above and CSI score were used. Since there was a need to analyze several variables, the clustering was done in a multi-step statistical process: Principal component analysis (PCA) for dimensionality reduction, followed by candidate model evaluation. The aim was to minimize the within-cluster variation, thus the performance metric used for model evaluation was the silhouette score (the higher the score, the better the clusters). The clusters were expected to satisfy two main properties: 1) cohesion: households in clusters should be similar to one another and 2) separation: households across clusters should be as different as possible. An unsupervised machine learning model would be applicable for grouping households in subgroups when all household characteristics, outlined as features, are known including the household food insecurity level.
- K-Means Clustering
- Gaussian Mixture Model (GMM)
K-Means clustering was used to group similar households together into clusters. The model identified a number of clusters to create, and then iteratively assigned each household to the cluster that was most similar to it, based on the specified features. The model then adjusted the clusters to better reflect the data, and repeated this process until the clusters were stable. The best average silhouette score was 0.4 at 2 clusters.
We also used GMM, a probabilistic model, to cluster households into groups based on their likelihood of belonging to each cluster. The model assumed that each cluster was represented by a Gaussian distribution, and that the data points in the cluster were drawn from that distribution. The model then estimated the parameters of the Gaussian distributions for each cluster, and assigned each data point to the cluster with the highest likelihood. The best average silhouette score was 0.4 at 2 clusters.
K-Means and GMM had the same silhouette score and 2 clusters each, so we picked K-Means as our best performing model since it is a simpler and more intuitive model to understand and interpret compared to GMM
Optimization
After profiling Nigerian households into subgroups (i.e. using supervised and unsupervised learning models), the median weekly food expenditure for each subgroup and average food consumption for each food item were computed and used as parameters for the optimization models. The goal of the optimization model was to design an optimal food basket for household subgroups. Two optimization models were designed for each subgroup: a low-cost food basket model and a low-cost food basket model optimized for cultural acceptability.
Low-cost Food Basket
The low-cost food basket optimization model was used to identify the most cost-effective way to purchase a set of food items that meet a specified nutritional requirement. The model was set up to consider food item prices, nutritional content and availability of different food items, then using a linear programming model, find the combination of food items that provide nutrients to satisfy the daily reference values outlined by the U.S. FDA.
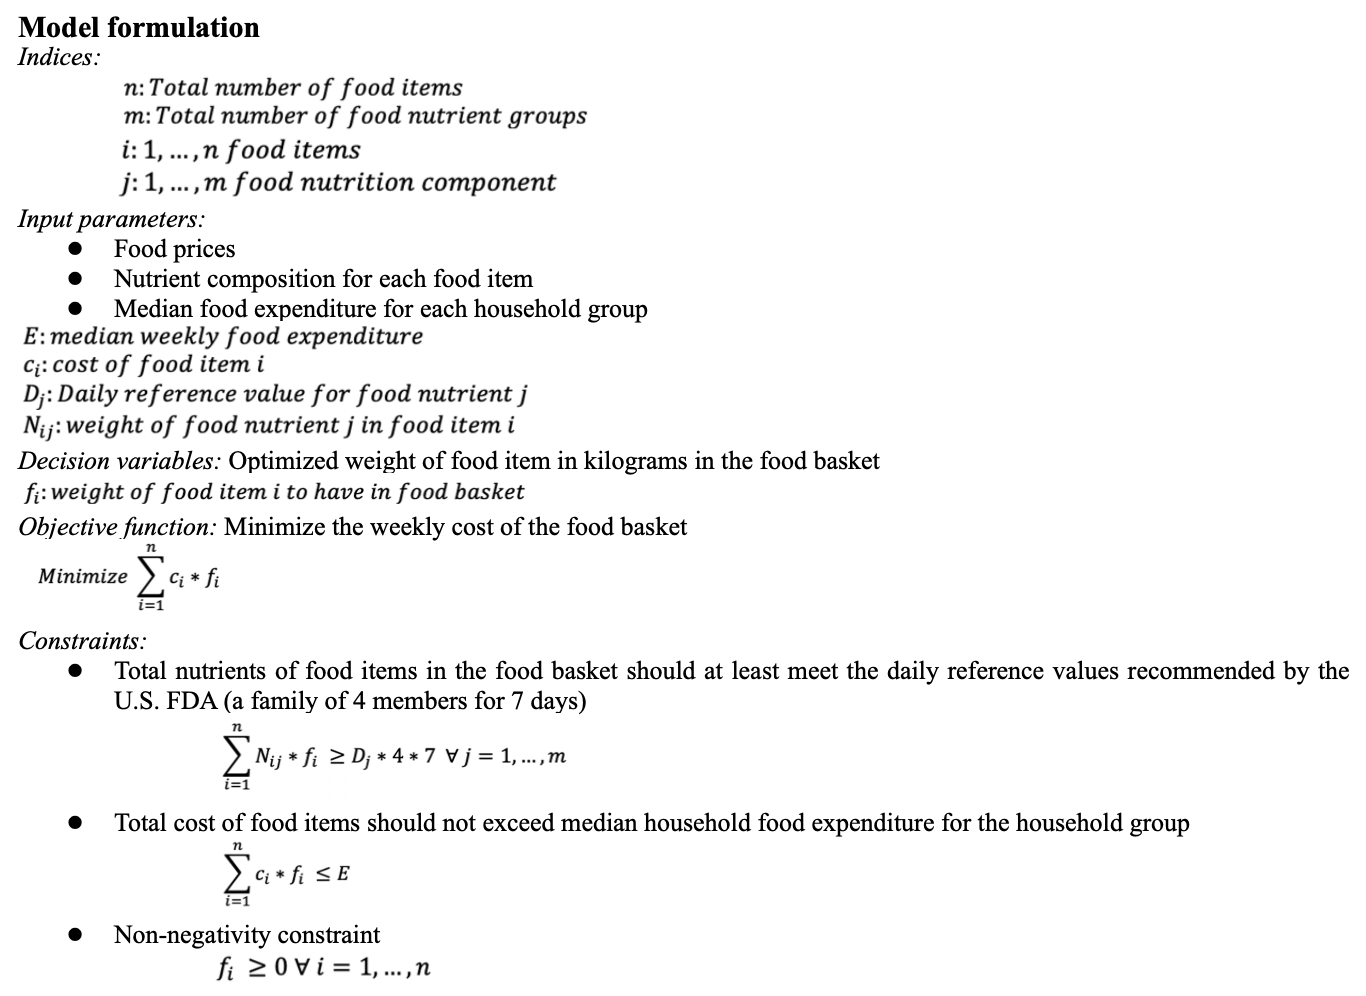
Low-cost & Culturally Acceptable Food Basket
The second optimization model is similar to the first model as it also optimizes for cost-effectiveness based on the same constraints but it is enhanced to consider the food shopping patterns of household groups based on previous average food consumption behavior for the group as an indicator for food consumption preference. Thus, its objective is to minimize the deviation of candidate food basket items from reported food intake for a specific household group. This ensures that the candidate food basket items are food items that the households are familiar with.
Machine Learning Results
Supervised Learning Models
Overall, our supervised learning models gave prediction accuracy of less than 60% and the random forest test accuracy (best performing model) was also slightly under 60% at 57.8%. Suggesting that the model did not perform particularly well in terms of accurately predicting the classes of the households. This was not strange since the data is highly imbalanced and is a multi-class classification problem not a binary classification problem; thus, the accuracy might not be reflective of the true misclassifications for each class. This was confirmed by visualizing the classifications for each subgroup as shown in Fig.8; poor performance for group 2 and 3. Consequently, we used the hamming loss metric to determine the fraction of labels that were incorrectly predicted on average. The hamming loss value was 0.42 indicating that 42% of the observations were incorrectly classified. Concerns are addressed in Limitations section and proposed improvements are stated in Future Work section. In general, our results indicate that the model does not effectively capture the underlying patterns and relationships in the data, and that it may be overfitting or underfitting to the training data. Thus, the model needs to be improved or revised for better prediction performance.
Unsupervised Learning Models
The final k-means clustering model was run with k = 2 and a silhouette score of 0.4, meaning that the model identified two clusters in the data and indicates that the data points in the two clusters are moderately well-separated from each other. This suggests that the model was able to effectively identify two distinct groups of households, with relatively little overlap between the two clusters. However, the relatively low silhouette score also indicates that there may be some data points that were not clearly assigned to one cluster or the other, or that the two clusters are not as distinct as they could be. In general, our results indicate that the model performed reasonably well in identifying distinct clusters in the data, but that there may be some room for improvement.
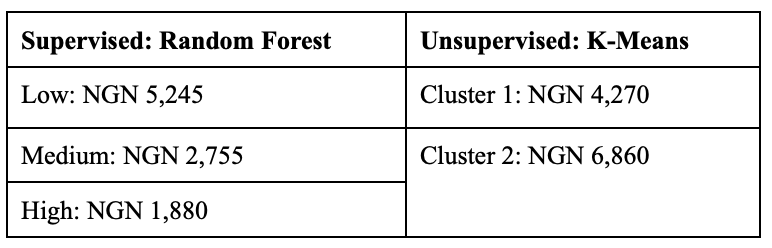
The table below shows the median food expenditure for each household group identified by the machine learning models and used as parameters for the optimization models:
Optimization Results
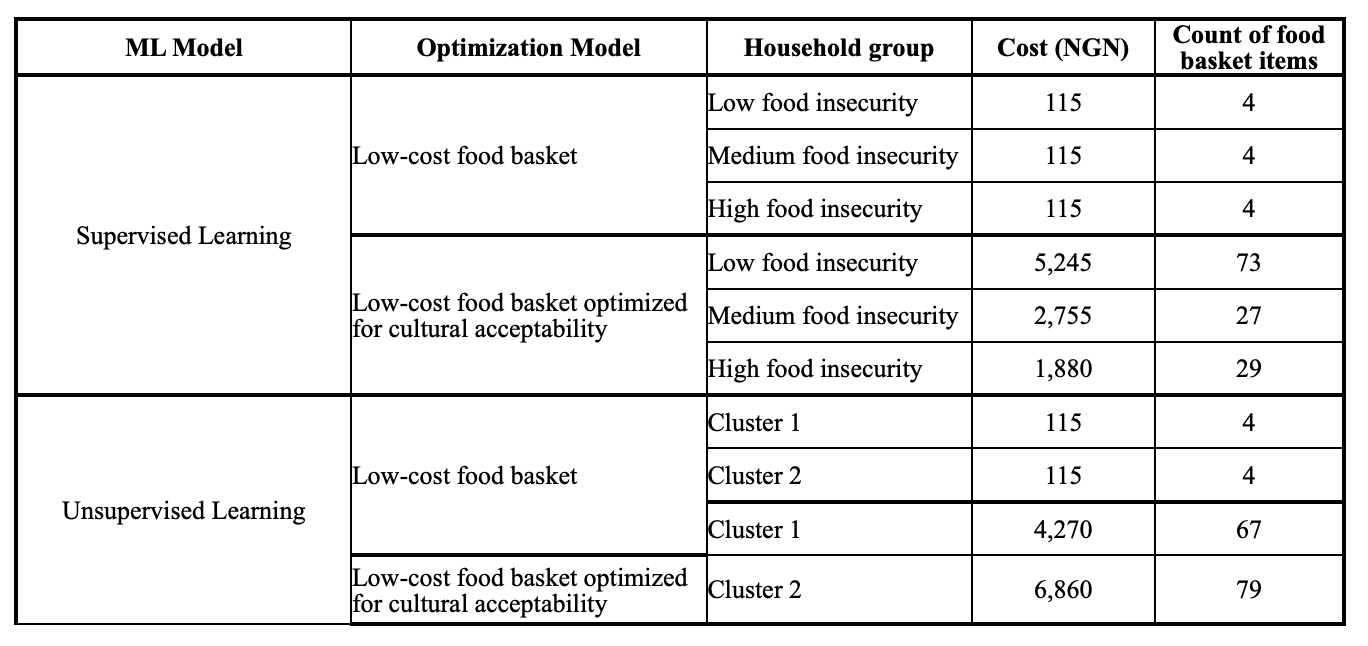
Since the low-cost food basket model was focused on finding the most affordable combination of food items that meet the recommended nutrient reference values, the total food basket costs are generally low (about NGN 115) and comprise of few (4) food items for both machine learning subgroups. In contrast, the low-cost food basket optimized for cultural acceptability takes into account the food purchasing patterns of households in addition to the cost and nutrient constraints, thus the results include a wider range of food items in the optimal food basket and the cost constraints are binding with zero slack (i.e. equal to the median food expenditure for each group).
The table below shows summarized optimization results[6] for both machine learning and optimization models:
The stakeholders for our project are Nigerian households, the Nigerian Ministry of Health, the National Agency for Food and Drug Administration and Control (NAFDAC), the Federal Ministry of Humanitarian Affairs, and Disaster Management and Social Development. The latter three are our policymakers of interest that are best suited to coordinate and implement our policy recommendations. Thus, based on our optimization results, we recommend:
Adopt optimized food basket model (low-cost & cultural acceptability) for hunger intervention programs or policies aimed at reducing the food insecurity burden for Nigerian households. This could include initiatives such as subsidizing the cost of healthy, culturally-acceptable food items, or working with local organizations to increase the availability and accessibility of such foods in low-income communities.
Incorporate estimated food basket cost as a critical component when determining transfer values for cash transfer programs such as the Conditional Cash Transfer program or the National Cash Transfer program.
Provide education and resources on healthy eating and budgeting to help Nigerian households make the most of their limited food budgets while eating nutritious food.
In conclusion, the low-cost and culturally acceptable food basket optimization plan for Nigerian households aims to help individuals and families on a budget access affordable, nutritious and culturally-appropriate food options based on past consumption preferences; thereby reducing their food insecurity burden. By implementing this plan, policymakers can help improve the nutritional status of lower-income Nigerian households, while also supporting local food consumption practices.
Limitations
The project is subject to the following limitations:
Data:
Majority of food items in the survey dataset have non-standard units of measurement e.g. cup sizes are measured using repurposed cans, not standard cup measurement. Additionally, there are possible measurement inaccuracies due to erroneous or missing data in survey responses. Thus, there might have been discrepancies during the food items nutrient conversion process.
Ideally, the CSI index should be computed based on frequency (e.g. count of days) of coping behaviors. However, the survey data records the responses to coping behaviors using Yes/No responses. This means our computed CSI values may be biased.
- Ideally food baskets should be based on data from national food intake surveys but due to data unavailability, our project uses general household survey data instead.
- The U.S. FDA daily reference values were used since the daily reference values by the Nigerian NAFDAC were unobtainable.
- Only one week’s food expenditure is considered for our food basket design.
Analytical:
The prediction accuracy of the best performing model was lower than 60% indicating that there could be other features outside the dataset that are better predictors of food insecurity level which are currently not considered in our model.
- Limited food nutrients are considered, hence, the optimized food baskets are not aimed at defining optimized diets.
- Cost calculated is only the cost of food items; thus, extra costs incurred for food processing, preparation and storage are not considered.
Economic:
- Food prices are subject to seasonal fluctuations and volatility because of the global market and local retailer selling policies.
Future Work
Improve classification model by considering more features related to household financial status and food access e.g. nearness to markets or supermarkets, availability of food items in community.
Incorporate fuller nutrient constraints such as Recommended Nutrient Intake (RNI), Estimated Energy Requirements (EER) and utilize macronutrient distribution range to allow for flexibility of the optimization model.
Design food baskets for different household members and sectors (i.e. urban and rural) since household members might have different dietary requirements and different sectors have different food prices and food item availability.
Incorporate more food items into candidate food item list and create food groups with weights to ensure energy-giving and nutritious food items receive higher priority in food basket inclusion.
Switch from a deterministic to a stochastic food basket optimization model through simulation (simulating what the optimal food basket would look like with different weekly expenditure as an expense constraint). This could address the issue of households who spend less than the median weekly food expenditure of their household group not being able to afford the optimized food basket designed for their subgroup.